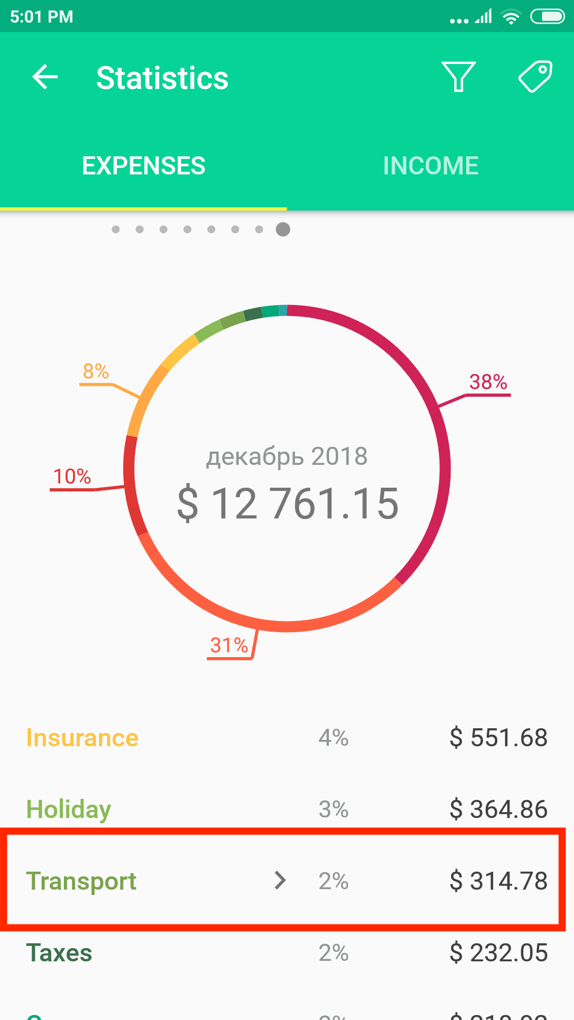
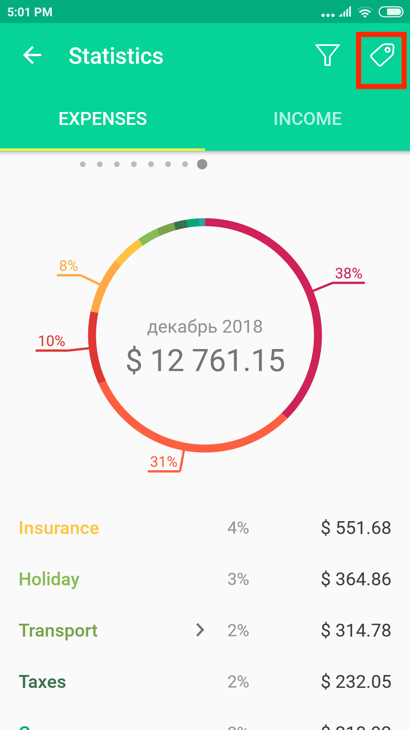
In the Menu section — "Statistics" you will see distribution of your expenses and income in categories / tags within a month (or other reporting period chosen by you).
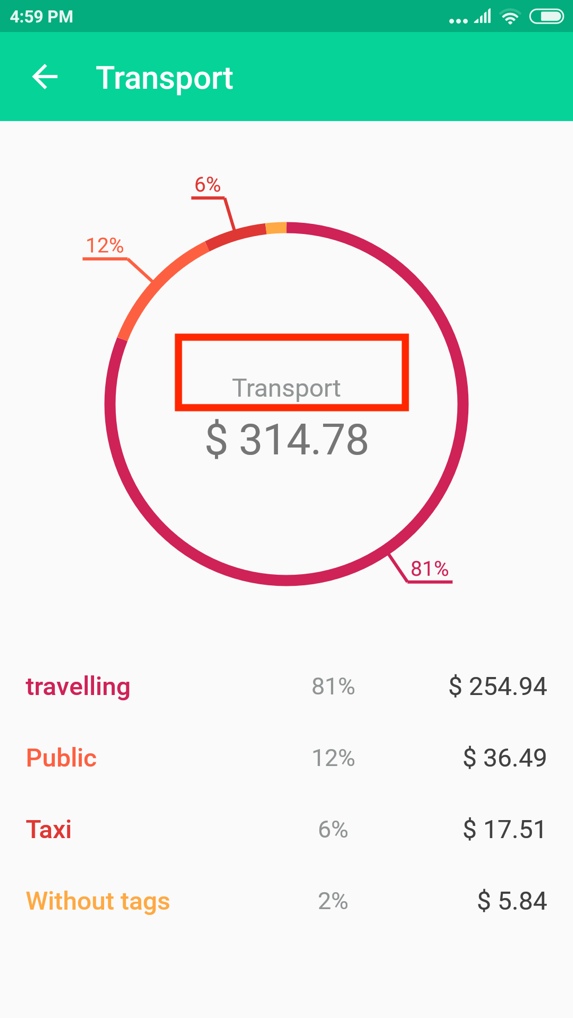
To see the expenses statistics in tags for a category, click on the name of category necessary to you under the chart.
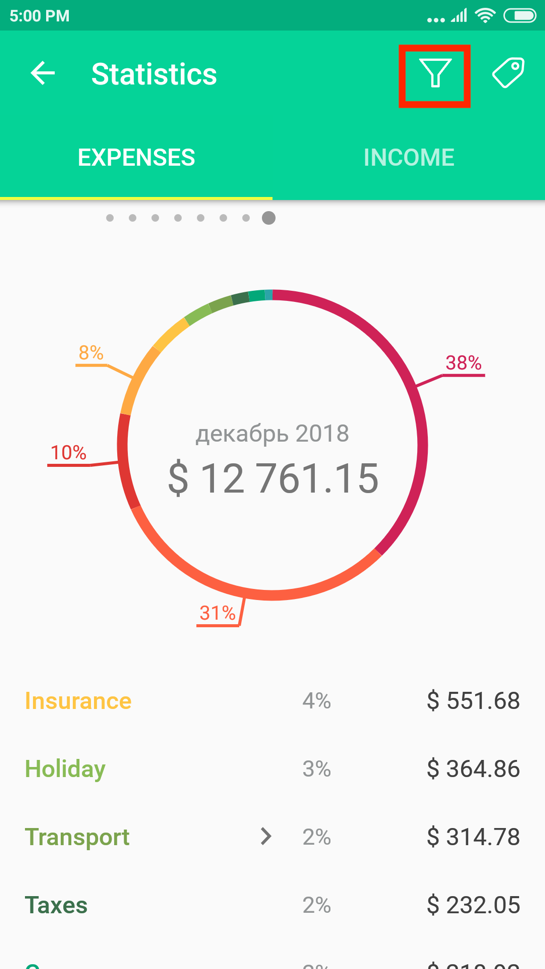
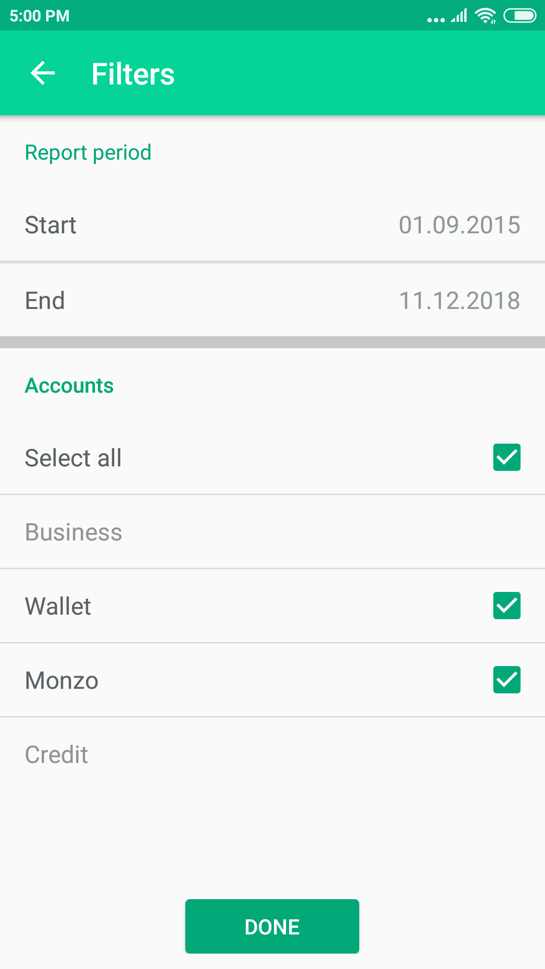
Only Premium or Platinum users can set filters to view the statistics on any reporting period.
Go to the Menu section — "Statistics" and click on the "Funnel" icon (filter) in the right top corner.
Here you can choose any reporting period (for example, week or year) and also to choose wallets or accounts which you want to be displayed in the statistics.
Some of the wallets in this list can be gray - they cannot be chosen because there are no operations, suitable for this type of the report in them.
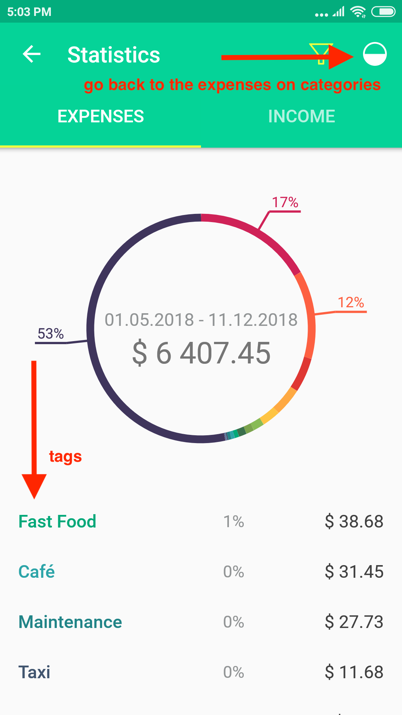
In the to the Menu section — "Statistics" click on a “Tag” icon in the right top corner. You will see your expenses on tags for the reporting period.
The reporting period can be changed, by clicking on the "Funnel" icon (filter) in the right top corner near the "Tag".
To get back to statistics displaying expenses on categories, click on the icon in the right top corner.
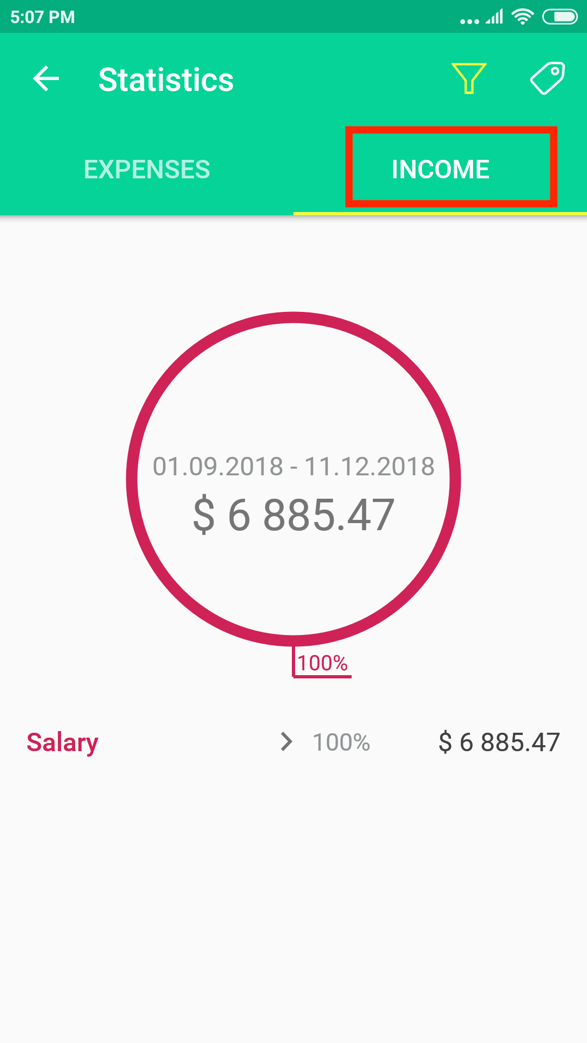
Statistics of Income
You can view the statistics of income the same way as the statistics of expenses.
In the to the Menu section choose "Statistics", then go to the “Income” tab.
As it goes with Expenses statistics, you can display statistics of Income for any reporting period or according to tags.